We launched Taipy in 2022 with a radical idea: creating powerful Python web applications as quickly as possible.
In just a few months since the last release, our users have delivered amazing software, from pilots to full-scale applications.
Our strategy is to provide full coverage with Taipy. We want Taipy to help with a wide range of Python developments: from simple pilots with dashboards to complex Python applications, multi-user, highly interactive, embedding AI models, etc.
The feedback has been fantastic, and we thank all our adopters in Europe, the US, and Asia. In this latest release, major features are on the menu.
To emphasize our low-code philosophy, creating pipeline configurations with Taipy backend needed an interactive editor, which is now the case with Taipy Studio.
Taipy Studio
With Taipy Studio, you can create a complete configuration for your pipelines and scenarios graphically. Such configurations can be saved as a TOML file which can then be loaded in your Python code to create pipeline instances and execution runs.
The previous Python method of creating your Pipeline DAGs is still available. It is still valid when facing dynamic pipelines (pipelines that can only be created programmatically).
Scenario/Pipeline Versioning
Indeed, there was a significant need for version management for Taipy pipeline/scenario configurations. An application is constantly evolving. Developers must maintain the configuration by modifying data sources, new tasks, etc. The new versioning system will naturally help manage this aspect from your command line.
Here we first list existing versions, then execute a scenario/pipeline in production mode with a new version number.
More on Taipy backend 2.1
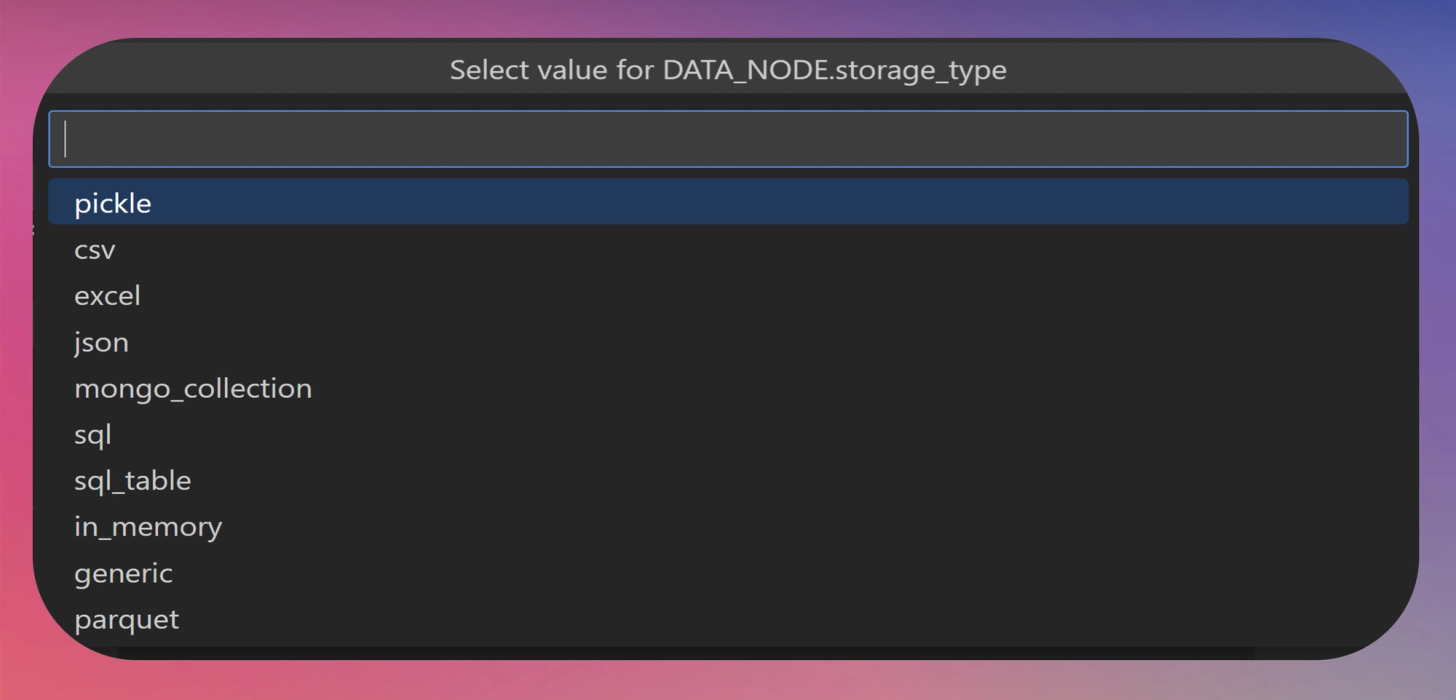
- Taipy has a new Parquet predefined Data node
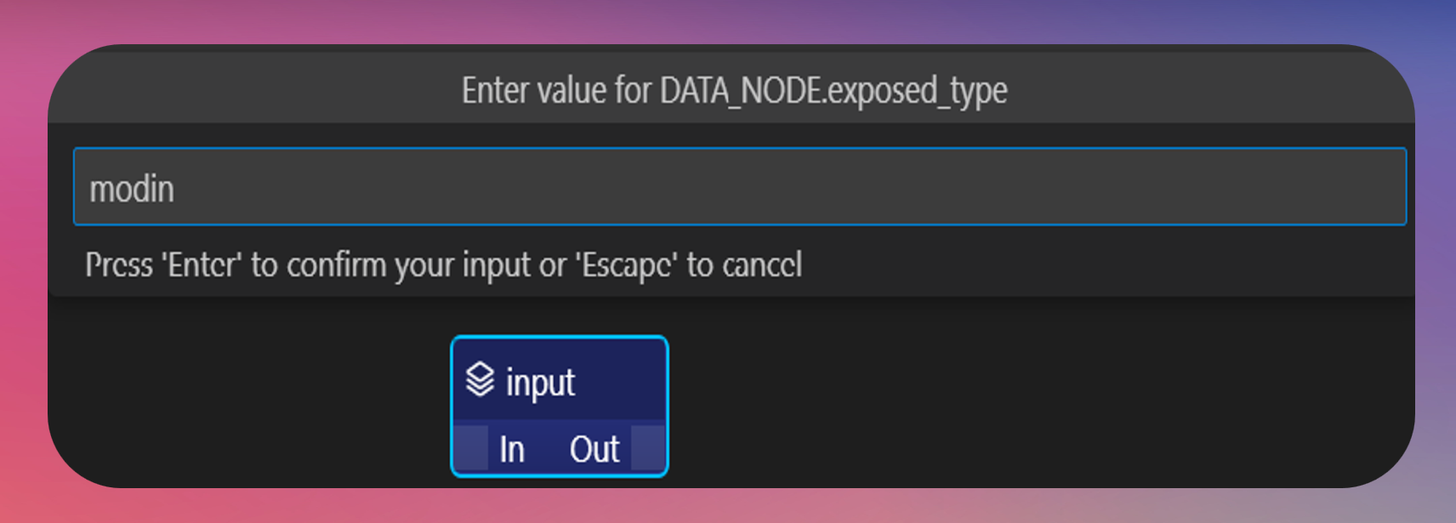
- Taipy is now integrated with Modin Dataframes. Our Data Nodes can now expose Modin Dataframes.
Taipy frontend 2.1
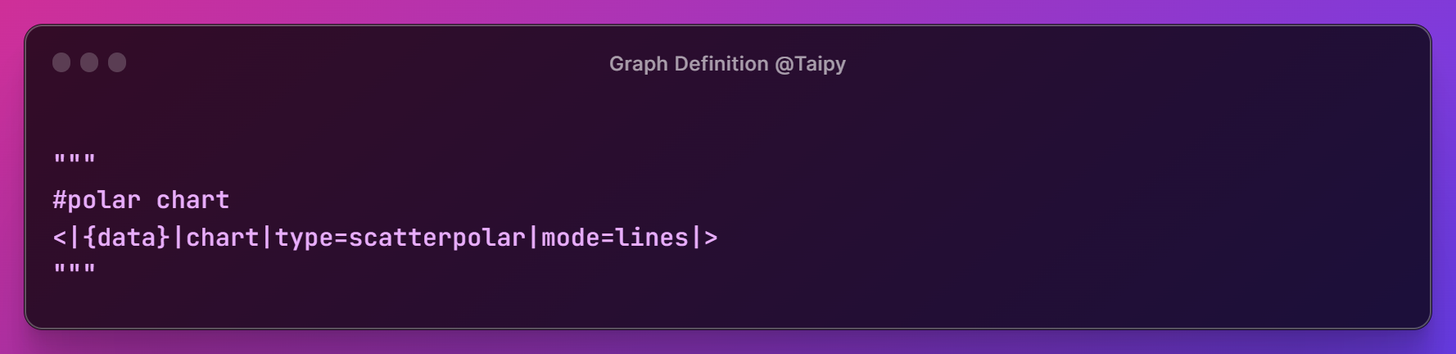
- First, many more charts are at your disposal: Bubble charts, Heatmaps, Error chars, Polar & Radar charts, Financial charts, etc.
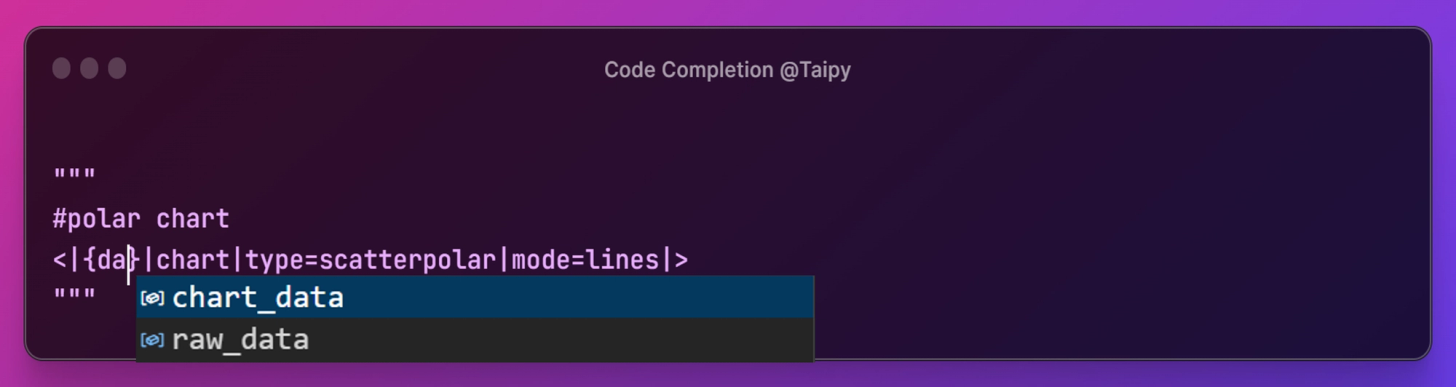
- Taipy Studio also brings a code auto-completion feature that is most helpful when writing Taipy frontend code.
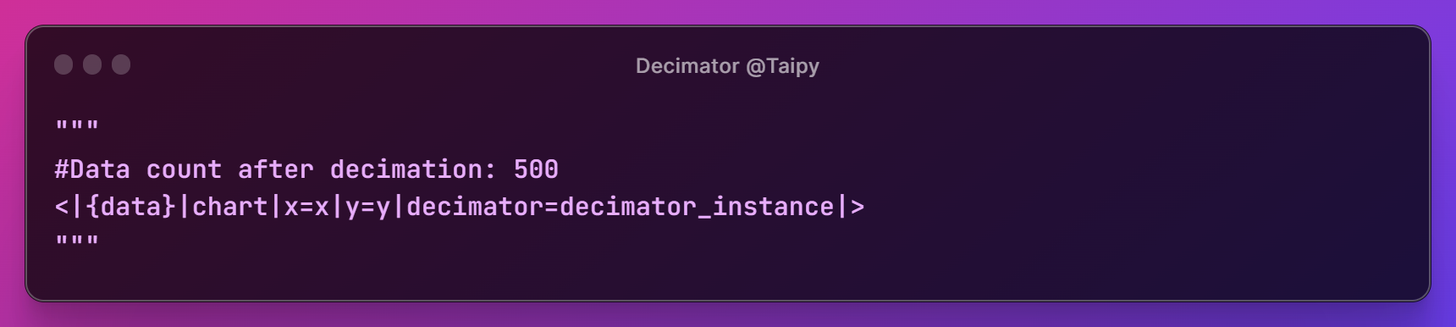
- The Decimator: This is a neat graphical filter for large data sets.
What does it do? Python charts are not made for large data sets. They usually crash or lead to cluttered graphics. The Decimator solves these issues. It removes the points that least modify the shape of the curve (for line charts) or the form of clusters (in the case of scatter plots), etc. Simply add a new property to your Taipy frontend charts to use it.
Since Taipy is very community-driven, do not hesitate to propose new features on our community discussion board or, even better, submit an issue on our git repositories.
Thank you for inspiring us with your feedback, enthusiasm, and creativity. Please keep sharing your applications. And keep sending us comments, ideas, bugs, feature requests, articles, and words of encouragement.
Have great fun developing pilots and projects with Taipy, and stay tuned for upcoming updates!
- Copied!