We build Taipy, the only low-code front-end and data management for your Python applications
Facilitating your application's front-end and back-end development with integrated services.
- 5x
reduction in project costs
- 10x
reduction in lines of code
- 4x
reduction in project duration
The history of Taipy

- Founded in2021
- MicrohubsOrsay, FranceSingapore, SingaporeCalifornia, USA
Taipy founders, Vincent Gosselin and Albert Antoine, with extensive backgrounds in leading software companies, transitioned from Java to Python a few years ago, driven by Python's increasing prominence in IT. Frustrated with the difficulty of bringing AI algorithms to the end-users, they created Taipy to address this challenge.
Now Taipy offers a solution to multiple challenges, empowering businesses with interactive, collaborative and user-centric AI applications.
Collaborative data processing
It is at the heart of Taipy's approach, involving a diverse team of experts including Data Scientists, Data Engineers, GUI developers, and MLOps specialists. Gartner's research underscores the enduring significance of Python in this realm, revealing that over 85% of Python-based pilot projects retain their pilot status.
Python tools for full-stack development
Taipy provides both frontend and backend components, enabling full-stack development in Python. The frontend allows for easy creation of GUI using Markdown language, while the backend schedules tasks and optimizes performance for efficient full-stack development
User-centric approach
User-centricity guides Taipy's approach, which addresses the dearth of Python tools spanning both front-end and back-end development. Python's rapid learning curve and robust application-building capabilities further accentuate its suitability for this purpose.
A management team that combines years of industry experience with todays innovative technologies
We are committed to helping organizations gain visibility into their IT infrastructure providing a platform that is flexible and easy to use.
 Vincent Gosselin
CEO & Co-founder
 Albert Antoine
Director & Co-founder
 Fabien Lelaquais
CTO
 Jean-Robin Medori
CPO
 Rym Michaut
Head of Digital Marketing and Communication
 Desmond Delandro
Senior Advisor to the board
 Myriam Delarue
Administration and Finance Manager
 Pr. Ngo Bao Chau
Senior Advisor to the board
 Vinh Nguyen
CFO
 Florian Jacta
Community Success Engineer
 Alexandre Sajus
Customer Success Engineer
 Frédéric Lefévère-Laoide
Senior Software Engineer
 Long Nguyen Dinh
Software Engineer
 Truong Giang Do
Python Developer
 Toan Quach
Backend Engineer
 Nam Nguyen
Software Engineer
 Nevo David
Fractional CMO
They speak for us
Whether standalone or paired, Taipy connects effortlessly with leading data platforms, amplifying your application's potential.
- Microsoft
- Les Mousquetaires
- Databricks
- Dataiku
- Princeton Consultants
- IBM Watson
- TTC AgriS
- Knowledge Touch
- Kdnuggets
- Tal Group
- AWS SageMaker
- Google Colab
- ICB
- SUAEE Group
- IFC
- IFP Energies nouvelles
Get started to drive your data in minutes
Join Taipy's development community today! Your contributions are greatly appreciated and will be duly acknowledged. Don't hesitate and be part of the Taipy adventure!
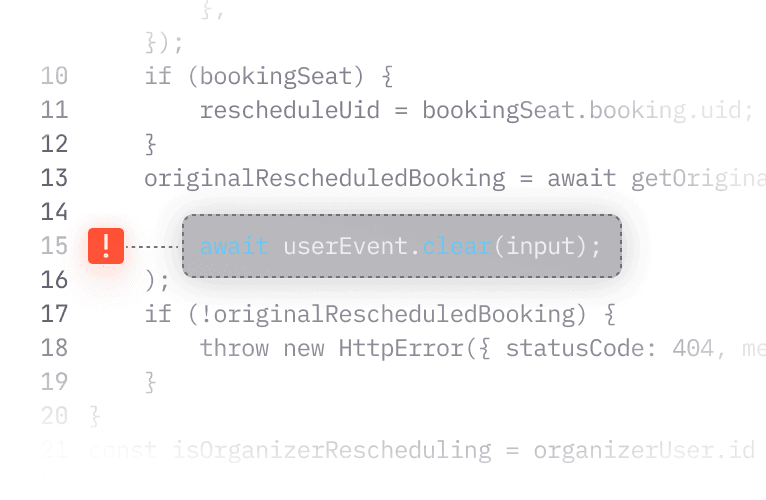
Fix bugs
Help us identify unwanted behaviors in the product and fix them.
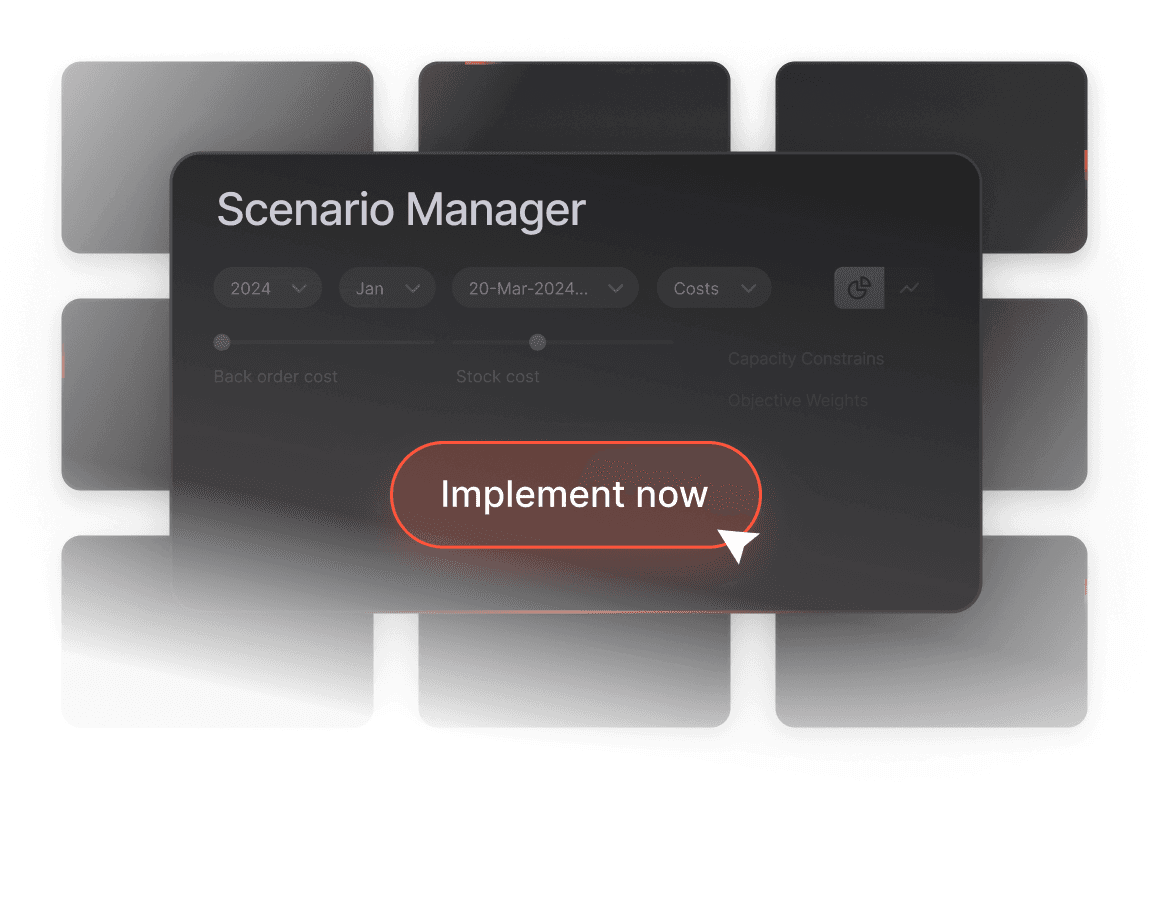
Implement features
Chose one of the incoming features from our list, or develop your own.
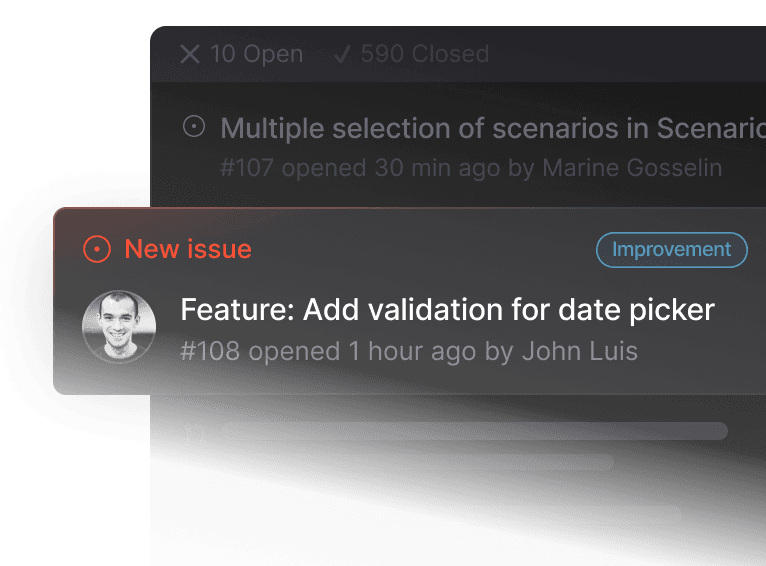
Submit feedback
Tell us what you love and what you would improve in Taipy.

Subscribe to the Newsletter
Subscribe to Taipy's newsletter and stay informed of the latest news! We send four mails per year plus a few more for very special announcements.